-
 Excel workbook preview
Project Quality, Testing and Acceptance
Project Quality Metrics Dashboard (defect density, pass rate)
3 downloads per free account, no card needed.
Who this is for
A test lead or PMO analyst who has to report quality trends to the steering committee every week.
What is inside
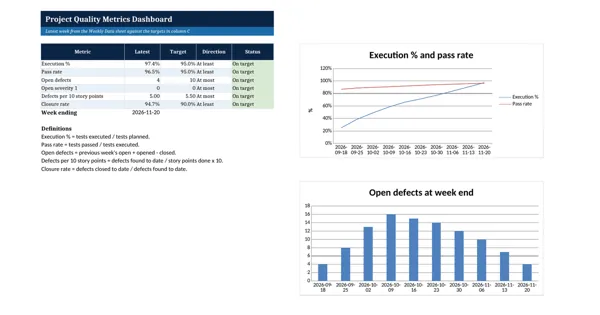
- 10 sample weeks of test and defect data with 6 calculated columns
- Pass rate, execution %, defect density per 10 story points and closure rate formulas
- Dashboard of 6 metrics against targets, On target or Off target in colour
- Line chart of execution % and pass rate; bar chart of open defects
- Open severity 1 above zero turns red on the data sheet
- Definitions of every metric on the dashboard
How to use it: Enter one row a week from the execution log and the Defect Log, set your targets on the Dashboard, and extend the chart range as weeks are added.
Files & formats
- XLSXproject-quality-metrics-dashboard.xlsx14 KB
Opens in Microsoft Word or Excel, Google Docs or Sheets and LibreOffice. Delivered instantly from your browser.
Free downloads & full access
Every account gets 3 free downloads. Re-downloading a template you already have does not count. This template on its own is $17.99, and buying it keeps your free downloads for something else. Full access is a one-time $249 for all 300 templates, for life.
Bought with a different email? Open your account and enter your order number.
Licence
Use and adapt the document inside your own organisation or for your own clients. Do not resell or republish the templates themselves.