-
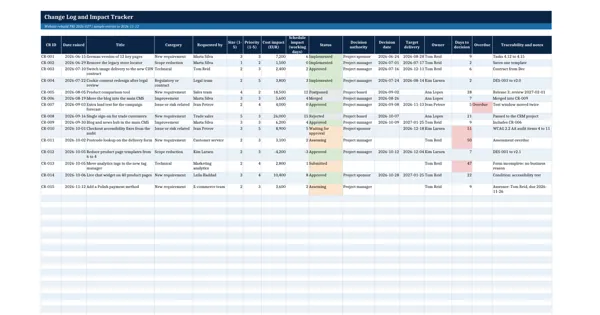
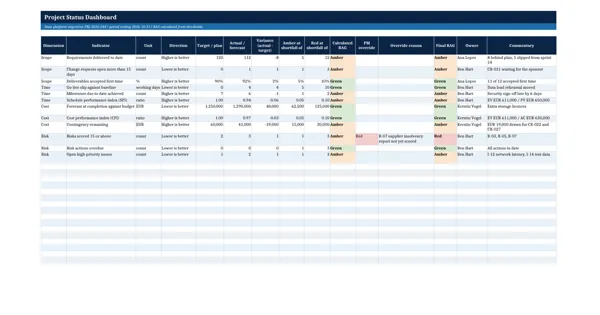 Excel workbook preview
Monitoring, Status Reporting and Change Control
Project Status Dashboard (RAG by scope, time, cost, risk)
3 downloads per free account, no card needed.
Who this is for
A project manager or PMO analyst asked by the sponsor for a one-page RAG view that is calculated from numbers, not set by feel.
What is inside
- 12 sample indicators across scope, time, cost and risk with targets and actuals
- RAG calculated live from amber and red thresholds in each indicator's own units
- Higher-is-better or lower-is-better direction per indicator, so SPI and slip both work
- Optional project manager override with a reason, kept apart from the calculated rating
- Summary sheet rolls each dimension up to its worst rating and counts Red, Amber and Green
- History sheet with six months of dimension ratings coloured automatically
How to use it: Replace the sample indicators with the measures your board agreed, set the amber and red thresholds per row, and enter the actual values each reporting period.
Files & formats
- XLSXproject-status-dashboard.xlsx14 KB
Opens in Microsoft Word or Excel, Google Docs or Sheets and LibreOffice. Delivered instantly from your browser.
Free downloads & full access
Every account gets 3 free downloads. Re-downloading a template you already have does not count. This template on its own is $17.99, and buying it keeps your free downloads for something else. Full access is a one-time $249 for all 300 templates, for life.
Bought with a different email? Open your account and enter your order number.
Licence
Use and adapt the document inside your own organisation or for your own clients. Do not resell or republish the templates themselves.
More in Monitoring, Status Reporting and Change Control
Monitoring, Status Reporting and Change Control
Weekly Status Report Template (one page)
Monitoring, Status Reporting and Change Control
Change Control Procedure
Monitoring, Status Reporting and Change Control
Change Request Form
Monitoring, Status Reporting and Change Control