-
 Excel workbook preview
Monitoring, Status Reporting and Change Control
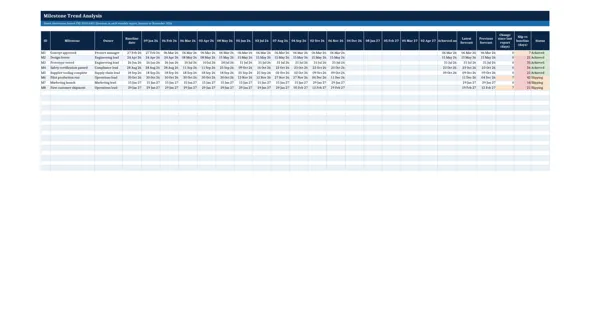
Milestone Trend Analysis Chart
3 downloads per free account, no card needed.
Who this is for
A project manager or sponsor who wants to see which milestones keep slipping from report to report, not just their latest dates.
What is inside
- 8 sample milestones of a product launch with 11 monthly forecasts each
- Latest forecast, slip against baseline and change since last report, live
- Status from achieved date and slip: Achieved, Slipping or On track
- Slip over 10 days turns red, any slip amber
- Line chart per milestone with the report-date diagonal
- Five blank report columns and 16 blank milestone rows
How to use it: At every report date, enter each milestone's current forecast in the next report column; the chart and slip columns update themselves.
Files & formats
- XLSXmilestone-trend-analysis-chart.xlsx14 KB
Opens in Microsoft Word or Excel, Google Docs or Sheets and LibreOffice. Delivered instantly from your browser.
Free downloads & full access
Every account gets 3 free downloads. Re-downloading a template you already have does not count. This template on its own is $17.99, and buying it keeps your free downloads for something else. Full access is a one-time $249 for all 300 templates, for life.
Bought with a different email? Open your account and enter your order number.
Licence
Use and adapt the document inside your own organisation or for your own clients. Do not resell or republish the templates themselves.
More in Monitoring, Status Reporting and Change Control
Monitoring, Status Reporting and Change Control
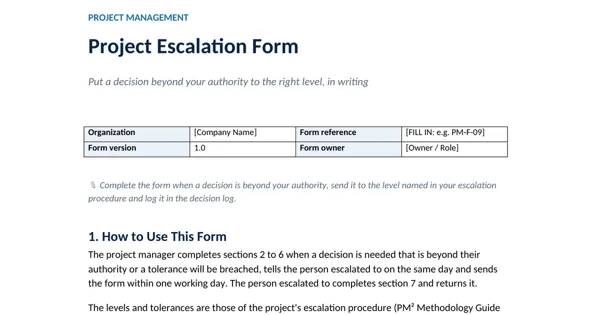
Project Escalation Form
Monitoring, Status Reporting and Change Control
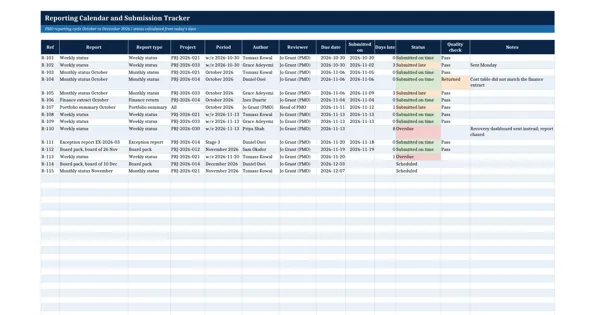
Reporting Calendar and Submission Tracker
Monitoring, Status Reporting and Change Control
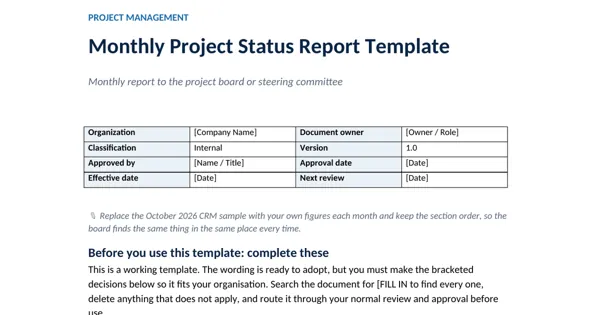
Monthly Project Status Report Template
Monitoring, Status Reporting and Change Control